
Advanced Quality Module / PAT
Advanced Quality Module / Part Average Testing
Part Average Testing, neighborhood rules, value-shift detection, and shot/stack analysis for automotive and other zero-defect industries — catching parts that pass standard test limits but show suspicious deviation from the majority of tested parts or sit near failed devices. No normal distribution is assumed, so the screening goes far beyond classic PAT.
Capabilities
Advanced Quality Module / PAT: what it does
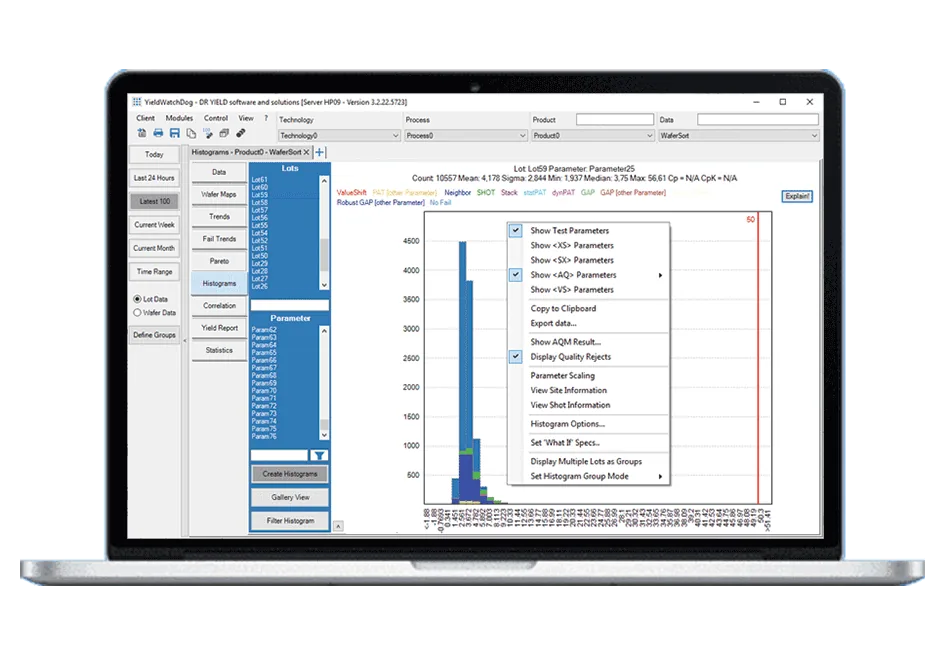
- Neighborhood rules: check the neighbors of every failed device for further failures
- Value shift: compare subsequent measurements of the same part — e.g. pre-/post-burn-in or high-/low-temperature tests — and flag shifts that are too high
- Static PAT (limits calculated once, applied every x lots or y days), dynamic PAT (limits per wafer from current data) and gap-based PAT (screens parts that deviate from the bulk distribution)
- Robust variants: median instead of mean, IQR instead of standard deviation
- Shot analysis: screens chips at litho-shot or test-site positions where a defined share of the other chips fail, mostly to catch incomplete repeaters
- Stack analysis (Z-PAT): screens chips at coordinates where a defined share of the same positions fail across the wafers of a lot
- Configurable per product, test insertion, and customer requirements
- Built for automotive and other zero-defect industries, aligned with frameworks like AEC-Q001
Related pages
Support
Direct support from our experts
A direct technical contact who understands the software and the industry — no ticketing queue, the same level of support regardless of company size.
See it working on your own data
Low-cost trial installations are available. Our team will write the loaders and parsers for your data during the installation.
Schedule DemoFAQ
Frequently asked questions
What is Part Average Testing (PAT)?
Part Average Testing is a statistical method for outlier detection. Product engineers identify every die whose parametric characteristics fall outside a statistically calculated pass-fail limit: upper and lower PAT limits are calculated from the test data of the population, and everything outside them is screened out. PAT matters most in quality-critical industries such as automotive, where the goal is zero defects and parts that pass the specification limits but behave suspiciously compared with their peers must not ship. In YieldWatchDog, PAT is one of the main features of the Advanced Quality Module. Because no normal distribution is assumed, the module also identifies weak parts that classic PAT misses, using neighborhood rules, value-shift detection, shot analysis and stack analysis alongside PAT. Limits can be configured per product, test insertion and customer requirements.
What is the difference between static, dynamic and gap-based PAT?
Static PAT calculates the upper and lower limits once and applies them for every x lots or y days. Dynamic PAT calculates limits for each wafer from its current test data; it can only be applied after static PAT has been set up. Gap-based PAT screens parts that deviate significantly from the bulk distribution: it checks whether a bulk distribution exists and whether there is a gap between that bulk and a part, which makes it robust for non-Gaussian distributions. Robust variants of the limit calculation use the median instead of the mean and the interquartile range (IQR) instead of the standard deviation, so that the outliers themselves do not distort the limits. Which variant fits depends on the parameter and the product, which is why the settings are configurable per product and test insertion.
Which quality problems do neighborhood rules, value shift, shot analysis and stack analysis catch?
Neighborhood rules check how many neighboring chips of each failed device are failed devices too, to find good-looking parts sitting among failures. Value shift compares subsequent measurements of the same part — for example pre-burn-in and post-burn-in, or high-temperature and low-temperature tests — and flags shifts that are larger than expected. Shot analysis screens chips at a litho-shot or test-site position where at least a defined share of the other chips at that position fail, mostly to catch incomplete repeaters. Stack analysis, also known as Z-PAT, screens chips at coordinates where a defined share of the same positions fail across the wafers of one lot, and flags the remaining devices in such a stack. Together they identify integrated circuits that pass the test limits but show suspicious behavior.