
Custom Calculations Module
Custom Calculations Module
The Custom Calculations Module lets you define your own calculated parameters with mathematical expressions — calculated at import or live in the client — and use them like any measured parameter in the wafer map, trend, fail trend, pareto, histogram, correlation and report views.
Capabilities
Custom Calculations Module: what it does
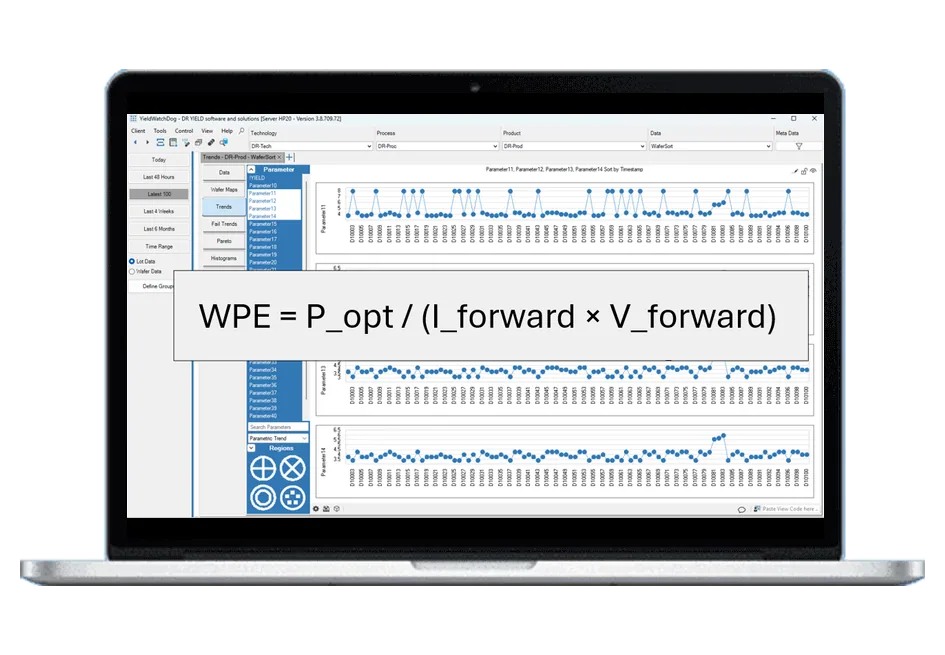
- Expressions with named placeholders and constants, evaluated in the editor before use
- Single-parameter, multi-parameter and stacked-wafer-map parameters
- Stacked wafer map aggregations such as mean, median, count, min, max, fail rate, sigma, range and bin percentage
- Each custom parameter can carry its own USL, LSL, target and unit
- Calculated at import time or live in the client
- Available in the wafer map, trend, fail trend, pareto, histogram, correlation and report views
Related pages
Support
Direct support from our experts
A direct technical contact who understands the software and the industry — no ticketing queue, the same level of support regardless of company size.
See it working on your own data
Low-cost trial installations are available. Our team will write the loaders and parsers for your data during the installation.
Schedule DemoFAQ
Frequently asked questions
What is a custom calculated parameter?
A custom parameter is a parameter you define yourself with a mathematical expression. In the expression editor you give the expression a name, write the formula with named placeholders and constants, and test it with the Evaluate button before using it. Single-parameter, multi-parameter and stacked-wafer-map parameters are supported, and each custom parameter can carry its own upper and lower specification limit, target and unit, so it behaves like any measured parameter.
When are custom parameters calculated?
Either at import time, when they are calculated and stored together with the measured data, or live in the client, which is useful for calculations you want to adjust quickly. The setting is made per custom parameter in the Custom Calculations dialog, where you also choose for which technology, process, product and data type it is active. Setting up custom parameters requires administrator or control-administrator rights.
Where can I use custom parameters?
Custom parameters appear in the parameter lists of the wafer map, trend, fail trend, pareto, histogram, correlation and report views through the entry “Show <CP> Parameters”. For stacked wafer maps the available aggregations include mean, median, count, minimum, maximum, fail rate, difference, sigma, range, bin percentage, bin count, most occurring bin and top-N bin count, which turn a stack of bin maps into a parameter map you can analyze like any other.