Equipment Monitoring Module
Equipment Monitoring Module
Enables the connection of your MES system to YieldWatchDog. Allows per-equipment statistical process control, with mean/sigma-shift thresholds, and tool-based parameter drift detection — plus tool commonality reporting and correlation charts across your full equipment history.
Capabilities
Equipment Monitoring Module: what it does
- Per-equipment SPC (mean/sigma-shift thresholds, control limits)
- Real EWMA and Shewhart-based drift detection — also covers test/probing equipment, catching probe-card degradation early
- Detects performance differences between similar tools — ideal for new equipment ramp-ups
- Automatic notification when a tool causes a statistically significant difference on a monitored parameter
- Trend, Box Plot and EWMA chart views grouped by equipment, chamber, recipe, run, rework or slot
- Correlation charts with equipment grouping and R² correlation values
- Tool commonality reporting — a separate, dedicated report; tool combination analysis is available as the Tool Combination extension
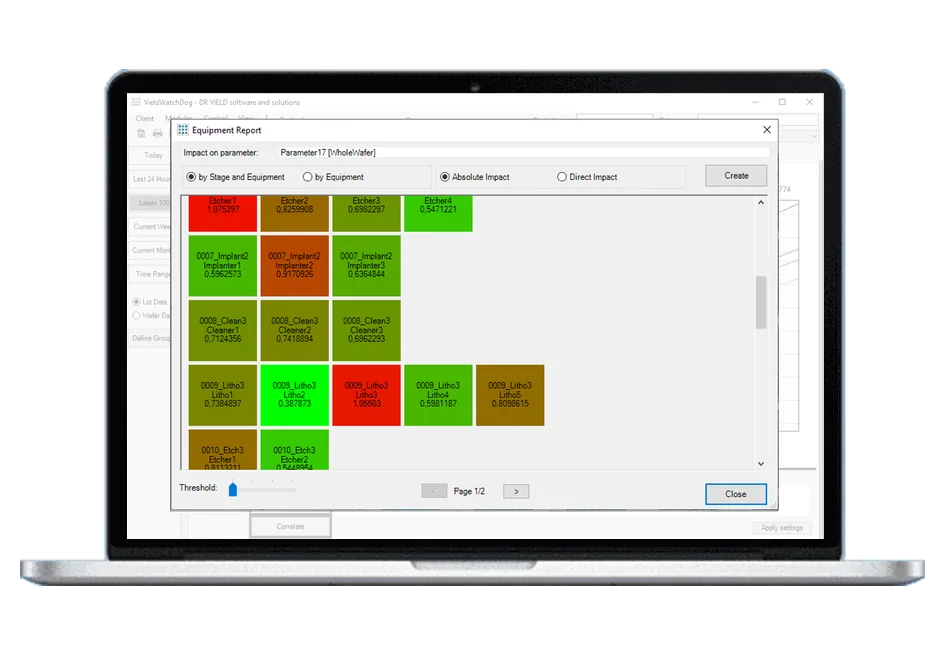
- Equipment Report: quantifies each tool’s statistical impact on a specific parameter
- Tool Commonality also compares good and bad lots side by side; Lot Equipment History shows every tool a lot has been through
- Optionally extended with AI-assisted "golden tool combinations" identification for routing critical lots
"Since we started using YieldWatchDog we have gained an enormous amount of value from our production test data."
Related pages
Support
Direct support from our experts
A direct technical contact who understands the software and the industry — no ticketing queue, the same level of support regardless of company size.
See it working on your own data
Low-cost trial installations are available. Our team will write the loaders and parsers for your data during the installation.
Schedule DemoFAQ
Frequently asked questions
Which tool problems does the Equipment Monitoring Module detect?
The module enables the control of specific tools using product test data. It detects statistically significant differences in the performance of similar tools, which makes it ideal for new equipment ramp-ups, and it shows drift of a tool over time with trend, box plot and EWMA charts grouped by equipment, chamber, recipe, run, rework or slot. Once parameter settings are made with a stage and an equipment filter, the importer automatically starts monitoring for trends caused by these tools and sends a notification when a tool causes a statistically significant difference on a parameter, for example “Significant statistical difference is detected for Parameter3, caused by EquipA3 in Stage4”.
Can it monitor test and probing equipment as well?
Yes. Because the module works from product test data, it can also be used for the control of test and probing equipment, which allows the fast detection of probe-card degradation. Equipment information is loaded from simple tab-separated equipment files with lot, stage, equipment, date and time, and optionally wafer, chamber, recipe, slot, rework and run. Equipment history can even be imported before the test data arrives: lots are created automatically, so the equipment data is ready when the first test results come in. Correlation charts grouped by equipment, with R² values per tool, show how strongly a tool is linked to a parameter.
What do the Tool Commonality and Equipment reports show?
The Tool Commonality Report groups selected lots — for example low-yielding lots — by stage and then by equipment, chamber or recipe, and shows for each tool the number of lots processed and the percentage; the good-versus-bad variant compares two groups of lots side by side. The Equipment Report creates a statistical report showing the impact each tool has on a specific parameter, as absolute impact (the mean of the normalized absolute deviations from the target) and direct impact (signed), with a threshold to ignore statistical noise. Lot Equipment History shows every tool a lot has been through, and all of these reports can be exported as CSV.