
Event Control Module
Event Control Module
Event Control brings fast and efficient coherence analysis of events and production failures: events such as equipment maintenance, supply changes or probe card changes are imported, shown in trend charts with before-and-after statistics, and users are notified automatically when an event causes a significant change.
Capabilities
Event Control Module: what it does
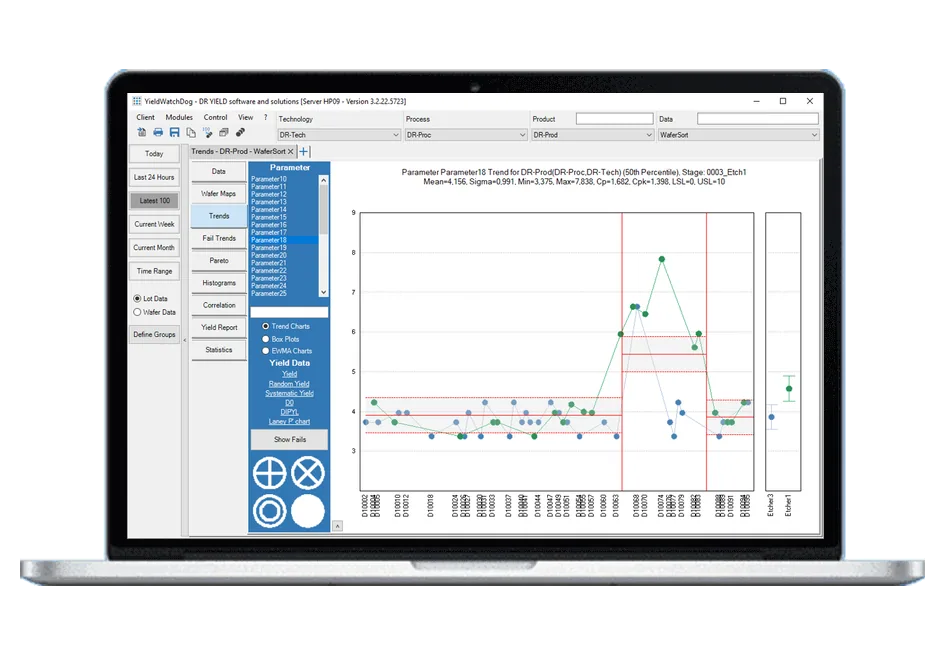
- Events imported from event files: event, equipment, date, time and optional comment
- Events shown in trend charts with statistics before, on and between events (mean, sigma, min, max, UCL/LCL, number of data points)
- Event settings per parameter, technology, process, product and data type, with configurable evaluation windows
- Event history per equipment and time range
- Per-user notification rules by event, equipment and parameter, with wildcards
- Applies to equipment level (e.g. bottle change), factory level (e.g. cleanroom temperature change) and test floor events (e.g. probe card changes)
Related pages
Support
Direct support from our experts
A direct technical contact who understands the software and the industry — no ticketing queue, the same level of support regardless of company size.
See it working on your own data
Low-cost trial installations are available. Our team will write the loaders and parsers for your data during the installation.
Schedule DemoFAQ
Frequently asked questions
What kind of events can Event Control analyze?
Event Control analyzes events at equipment level, such as tool maintenance or a bottle change, at factory level, such as a cleanroom temperature change, and on the test floor, such as probe card changes. Events are imported from event files with the event name, the equipment, the date and time and an optional comment. Once imported, the module brings fast and efficient coherence analysis of events and production failures, so you can see whether a change in the fab is followed by a change in your data.
What does the analysis show?
In trend charts the events are displayed directly on the data, together with statistics before the event, on the event and between two events: mean, sigma, minimum, maximum, the control limits and the number of data points. The module flags when the difference before and after an event is statistically significant. In the event settings you define per parameter, technology, process, product and data type how wide the evaluation window is and how many lots must be available before and after the event. The event history lists all events per equipment and time range.
Who is notified when an event changes the data?
Every user can set up notification rules by event, equipment, parameter, technology, process, product and data type, with wildcards, and can exclude events. When the analysis detects a significant change after an event, a notification is sent, including a trend image of the affected parameter with the events overlaid.