
Multivariate Monitoring Module
Multivariate Monitoring Module
T²-statistic and dimension-reduction (including PCA) monitoring across correlated parameters at once — catching problems invisible to any single parameter’s own control limits.
Capabilities
Multivariate Monitoring Module: what it does
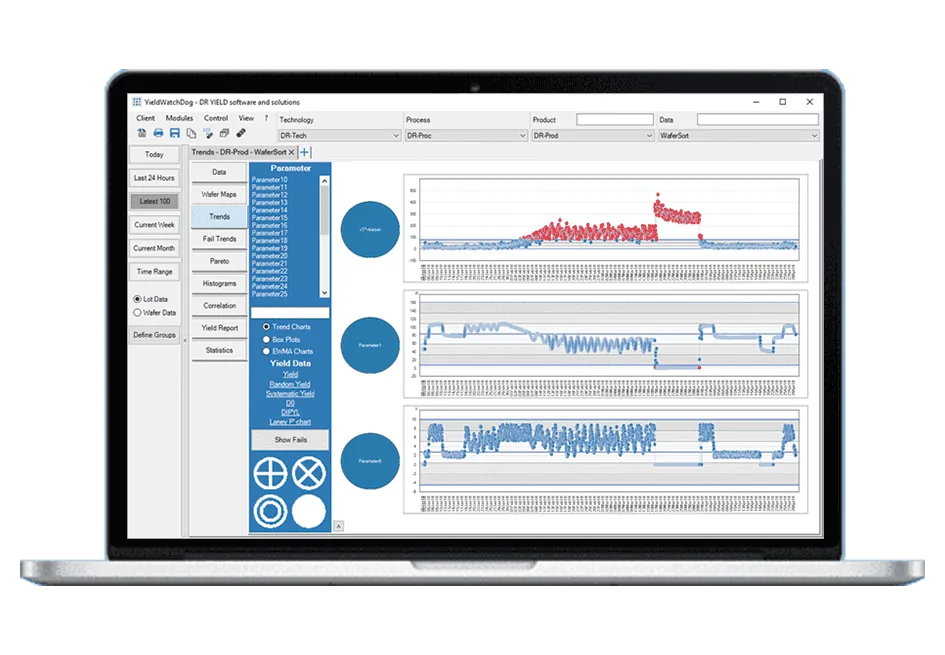
- Hotelling T² statistic across correlated parameters — one chart instead of dozens
- Catches problems invisible to single-parameter control limits
- Lot-wise, wafer-wise and regional monitoring
- Automatic notification when the correlation of a group of parameters changes
- Principal Component Analysis (dimension reduction) keeps processing fast, even across hundreds of parameters
- Fewer false alarms — monitoring one chart adds robustness to the detection
- Faster detection, so corrective actions can be taken immediately
Related pages
Support
Direct support from our experts
A direct technical contact who understands the software and the industry — no ticketing queue, the same level of support regardless of company size.
See it working on your own data
Low-cost trial installations are available. Our team will write the loaders and parsers for your data during the installation.
Schedule DemoFAQ
Frequently asked questions
What is multivariate monitoring?
Electrical test data often consists of dozens of correlated parameters. Univariate monitoring checks each parameter independently against its own control limits and ignores the correlation between them. Multivariate monitoring observes the correlation of multiple parameters and summarizes it in a single chart: the Hotelling T² statistic is the distance of each data point from the center of the multi-dimensional correlation ellipsoid, plotted as a time trend with control limits. A data point can sit inside the control limits of every single parameter and still be clearly outside the bulk of the distribution — the T² chart shows it. In YieldWatchDog, the Multivariate Monitoring Module notifies automatically about the effects introduced by a change in the correlation of a group of parameters, and it supports lot-wise, wafer-wise and regional monitoring.
Why watch one T² chart instead of many individual control charts?
A single chart gives an instant overview over a large number of parameters. The correlation between parameters is taken into account, problems are detected faster so that corrective actions can be taken immediately, and false alarms are reduced because the T² statistic adds robustness compared with watching dozens of individual charts. In one analysis for a manufacturing company, about 32 parameters of a tool were monitored individually: pressure and flow, which should correlate, stayed within their individual control limits while a valve started to leak, yet the T² statistic went outside its limits right away. The analysis was done after the event, but it showed that multivariate monitoring would have detected the leaking valve two weeks before its actual failure.
How fast is multivariate monitoring with hundreds of parameters?
Mathematically, any number of parameters can be modeled, and in semiconductor manufacturing there are often hundreds to analyze. Fast processing and calculation times are ensured by mechanisms such as dimension reduction with built-in Principal Component Analysis (PCA), which reduces the data set immensely, strips away unnecessary parts and saves computation time. Because only one chart needs to be monitored instead of dozens, engineers also spend less time on alarm triage. The module can be applied lot by lot, wafer by wafer or per region of the wafer, so the monitoring resolution matches the question you are asking of your data.