
Statistical Process Control
Statistical Process Control
Statistical Process Control monitors your parameters automatically as data is imported: control limits are calculated from the data or set by you, the Shewhart, Nelson and Western Electric rules and DR YIELD’s own rules are checked per lot or wafer, and responsible users are notified when a rule is violated.
Capabilities
Statistical Process Control: what it does
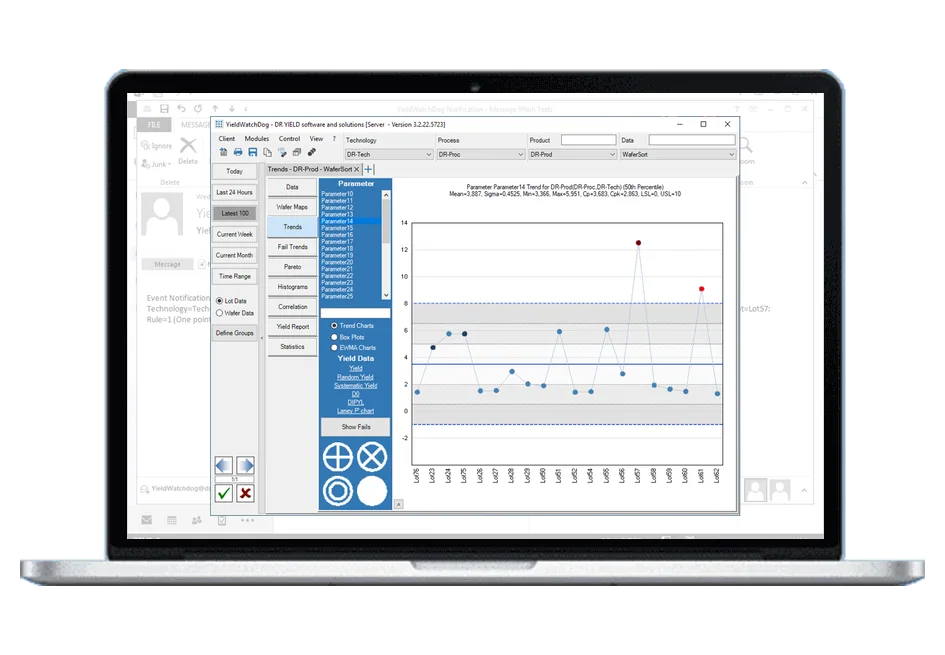
- Parameter settings by prioritized patterns for technology, process, product, data type and parameter
- Control limits calculated from the data or set manually, with automatic recalculation and limit history
- Shewhart, Nelson and Western Electric rules plus three DR YIELD rules, EWMA and I-charts
- Out-of-control action plans (OCAP) per rule
- Parameter overview showing which settings apply to a parameter
- Notification rules per user, and SPC-triggered reports with the Reporting Server
Related pages
Support
Direct support from our experts
A direct technical contact who understands the software and the industry — no ticketing queue, the same level of support regardless of company size.
See it working on your own data
Low-cost trial installations are available. Our team will write the loaders and parsers for your data during the installation.
Schedule DemoFAQ
Frequently asked questions
How does the monitoring run?
Monitoring runs on the server and starts automatically whenever data is imported: every imported lot or wafer is checked against the rules, and the client dialogs only configure it. Settings are defined as a prioritized list of patterns for technology, process, product, data type and parameter; the first matching pattern in the priority order wins. Monitoring can be lot-wise or wafer-wise, and a parameter overview shows which settings apply to a given parameter.
Which rules and charts are available?
The module checks the Shewhart, Nelson and Western Electric rules, such as points outside the control limits, runs on one side of the central line, steadily increasing or decreasing runs, and points in zones A, B and C, plus three DR YIELD rules for slope and for unusually small standard deviation. In addition there are EWMA charts, I-charts with sub-groups, range and standard-deviation based charts and fail-count monitoring. Out-of-control action plans (OCAP) can be attached to each rule, so the response to a violation is defined in advance.
How are control limits calculated and maintained?
Control limits can be calculated automatically from the data as target plus or minus a number of sigma, or set manually as custom upper and lower limits, and both can be combined. Calculate Target & Sigma recalculates the limits for selected parameters, either from the number of last data points defined on the server or from the data in the current client view, and the automatic recalculation can be configured. A history of control-limit changes is available when it is enabled in the database settings.