In order to analyze the vast amounts of data coming from the test equipment of semiconductor manufacturers, a premium, powerful software solution is required. High-performing software is a must as it enables fast and efficient processing of massive amounts of data.
As companies in the semiconductor industry strive to achieve manufacturing excellence, using yield analysis software allows test and yield engineers to improve yield and throughput, significantly increase productivity, save costs, reduce waste and reduce time-to-market.
The main stages in effective yield data analysis include: obtaining the data from semiconductor equipment, data integration, data analysis and obtaining the information needed for further actions. The knowledge gained results in the lifetime quality and reliability of the smart products that shape our lives.
With the YieldWatchDog software, Inova now has a tool that is capable of parallel production data processing, enabling the rapid load and analysis of large amounts of information. A variety of integrated functions allow different methods for inspecting production data. Easy to use automated rules for applying quality screening techniques further improve device filtering. This ensures a continuous delivery of products with the highest quality.
Dr. Malte Leisner, Head of Quality & Foundry Management at Inova
Data integration
Massive amounts of data derive from various semiconductor manufacturing and test equipment. Here the issue is the complexity of data as it is generated by different machines in the manufacturing process. In order to analyze the data, engineers are challenged with their data sources being in different formats and are not sure whether the different types of data can be “read” and integrated into one software solution. This is where data integration comes into play. Data integration is essential for any big data analysis and it entails homogenizing all data formats from the manufacturing and test equipment in order to make it readable by the software.
DR YIELD provides a complete, turn-key solution to analyzing your data. This means that data integration into our software YieldWatchDog is part of the installation package we offer all our customers.
After data integration, test and yield engineers can instantly retrieve their semiconductor data and use YieldWatchDog’s advanced analysis and visualization tools to unlock the hidden value of the data from the entire manufacturing process.
Key features of DR YIELD’s smart data analysis software are enhanced visualization tools, automatic notifications, supply chain visibility and equipment monitoring.
Semiconductor data visualization tools
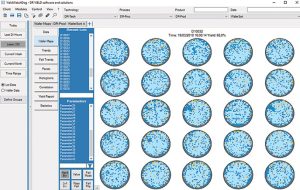
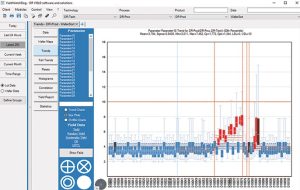
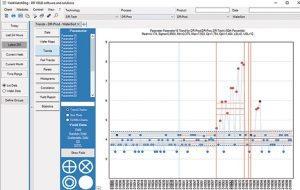
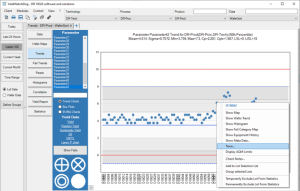
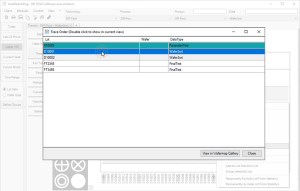
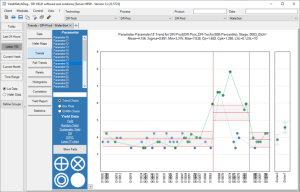
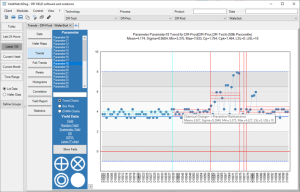
The enhanced visualization and calculation tools enable the user to gain a thorough understanding of the manufacturing process and its improvement possibilities. Wafer maps, trend charts, correlation charts, histograms (grouped/stacked), line charts, Pareto analyses, fail flip maps, fail trends, fail category maps, gallery views, and many more enhanced data visualization tools allow engineers to analyze and monitor equipment efficiently in order to optimize the manufacturing process. Analysis of factory events, complex yield issues and product ramp-ups are quick and easy using YieldWatchDog’s advanced analysis tools.
Automatic notifications and reports
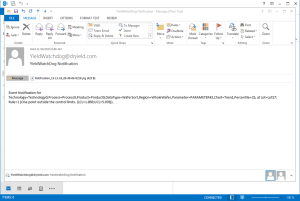
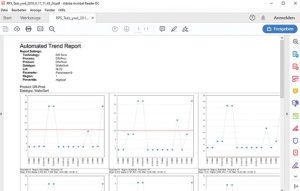
Data-driven decisions lead to higher productivity, which is why automatic notifications and reports are key for test and yield engineers to react the instant an irregularity occurs. As soon as YieldWatchDog detects any anomalies in the data such as slowly drifting parameters, spatial patterns on wafers or similar patterns on multiple wafers, it automatically sends out e-mail notifications reporting its findings. The reports are generated based on user-defined templates such as HTML or PDF and can be accessed by other engineers through the company’s intranet. Automatic reports can be set by the software user depending on their needs at any time, either periodically or even for every lot being processed.
Material tracing
Material tracing is another key feature of yield software to easily analyze complex yield issues that require insights into the full supply chain. It is a powerful genealogy tool that enables tracing the origin and movement of material along the entire manufacturing supply chain. Supply chain visibility enables full lot-, wafer- or device-level traceability, pinpoints equipment malfunctions and detects anomalies intelligently.
Equipment monitoring
The equipment monitoring feature allows test and yield engineers to detect statistically significant differences in the performance of semiconductor manufacturing tools. It monitors test and probing equipment performance by checking equipment impact on product test data.
Using YieldWatchDogXI, DR YIELD’s advanced analytics tool, equipment combinations can also be analyzed to determine the tool interactions with maximum efficiency. It helps to detect tools that, in combination, contribute to yield loss, or identify “golden tool combinations” for routing of important lots.
Event control
Event control enables the detection and notification of effects introduced by suspicious factory events such as equipment supply changes, maintenance events or similar. Analysis of events can be on a factory or on equipment level. Additionally, yield software users receive automatic e-mail notifications of factory events which enables them to react promptly and accordingly.
With YieldWatchDog, test and yield engineers in semiconductor manufacturing have a powerful and innovative software solution that makes the data work for them.
About DR YIELD software & solutions GmbH
DR YIELD provides the leading-edge advanced analytics software YieldWatchDog for analysis and control of semiconductor manufacturing and test data. This enables semiconductor manufacturers as well as Fabless companies to improve important manufacturing dimensions such as equipment availability, throughput, operating costs and yield. Once installed YieldWatchDog allows you to get actionable insights into your data. For detailed information click here

