Yield data analytics helps engineers and managers identify issues arising in the semiconductor manufacturing processes.
In semiconductor manufacturing, especially in electrical test data, but also in other parameters, there are often sets of parameters that are very highly correlated. Even a change in the correlation of those parameters may indicate a problem. For that reason, multivariate monitoring, or multivariate statistics, is applied to these parameters.
Multivariate analysis, also known as multivariate monitoring, enables the detection of issues that are invisible when viewing individual parameters. The software automatically notifies of the effects introduced by a change in the correlation of a group of parameters. Fast processing and calculation times are assured by deploying mechanisms such as Principal Analysis.
Multivariate Analysis supports lot-wise, wafer-wise and regional monitoring.
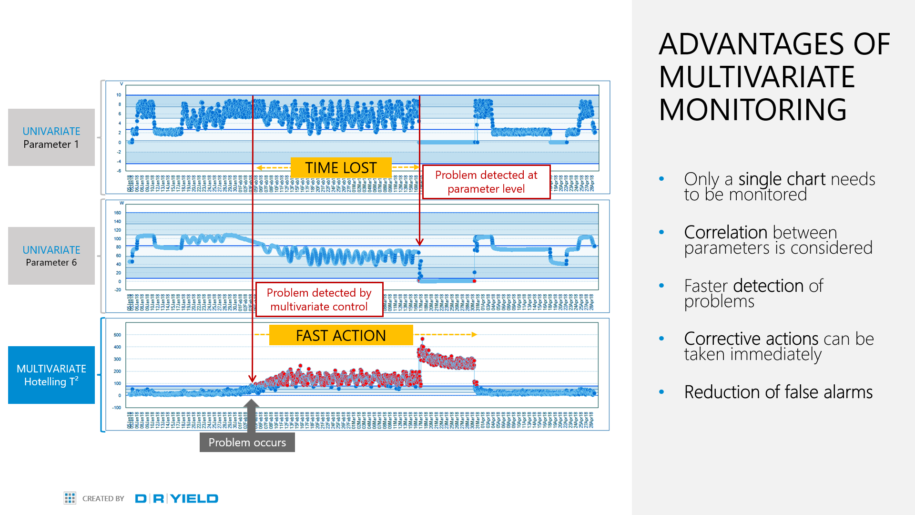
Advantages of Multivariate Monitoring
- Only a single chart needs to be monitored
- Correlation between parameters is considered
- Faster detection of problems
- Corrective actions can be taken immediately
- Reduction of false alarms
Multivariate Monitoring
There are two time trend parameters in the example below. Separately, all the values for both parameter X1 and X2 are within their respective control limits, including the parameter marked in red.
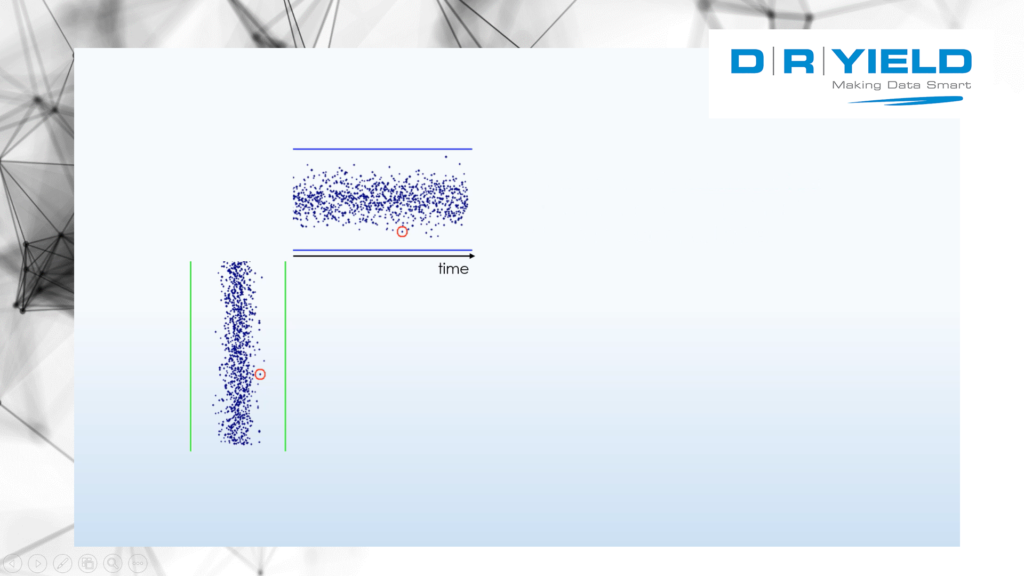
However, when all this data is plotted in a two-dimensional map, one data point that is within the control limits on the individual parameters is clearly outside the bulk of the distribution in this two-dimensional set. The correlation of these parameters shows that the red marked data point is an outlier. In a univariate chart, this parameter would not be detected. This plot shows a bi-variate correlation because we can only show two parameters in a 2-dimensional plane.
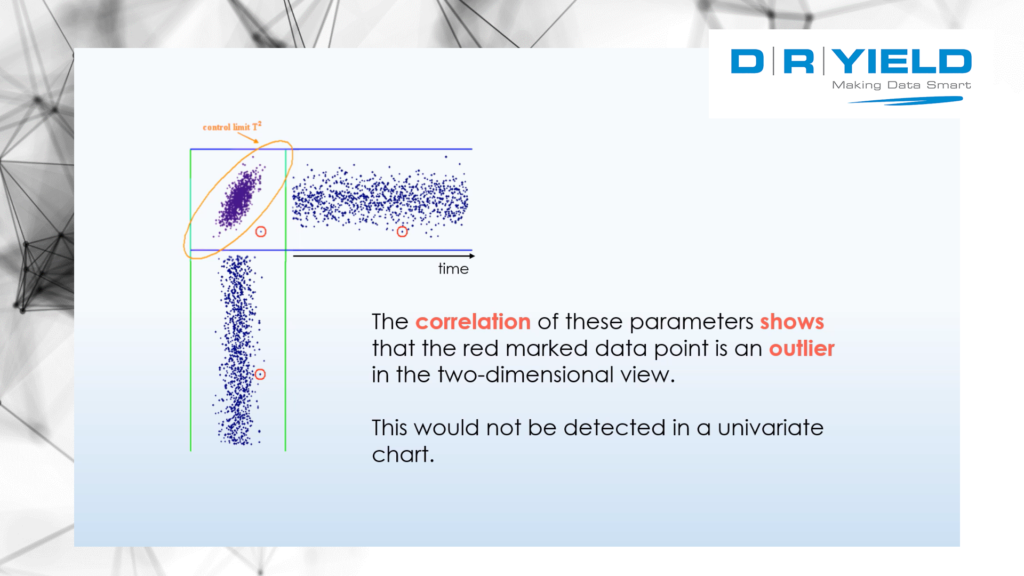
Mathematically we can model any number of dimensions with any number of parameters as in semiconductor manufacturing there are often hundreds of parameters to analyze.
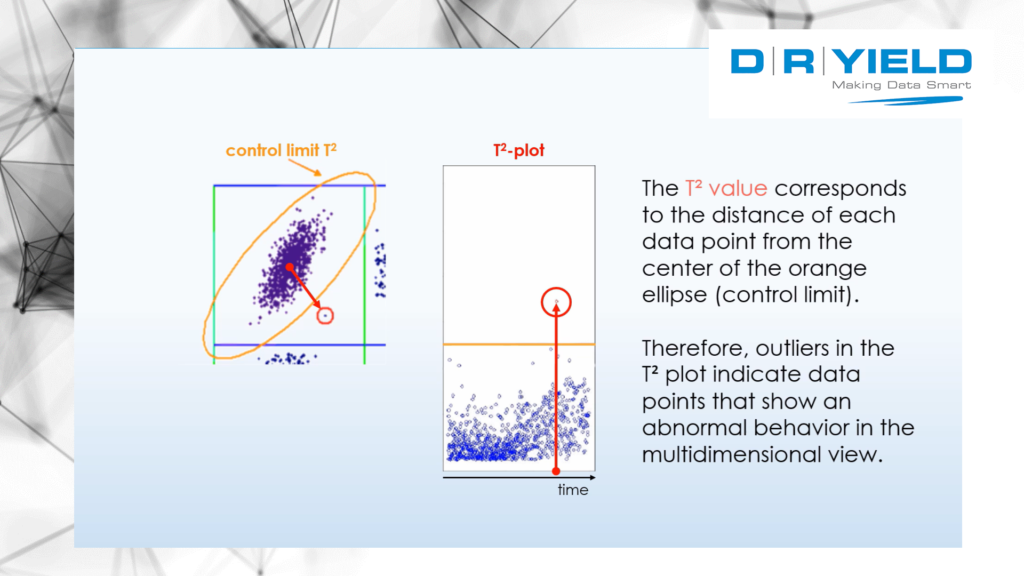
The T2 value is the distance of the individual data points from the center of the ellipsoid, or multidimensional/hyperdimensional ellipsoid. This distance is plotted as a time trend and control limits are applied to help engineers find abnormal data.
Case Study: Multivariate Monitoring for Manufacturers
Here is a real-world example of multivariate monitoring. In cooperation with a manufacturing company, we conducted an analysis of a production incident. “We were able to show that had the manufacturer applied YieldWatchDog Multivariate Monitoring, they would have detected pressure loss in a valve two weeks before its failure”, says Dieter Rathei, CEO of DR YIELD.
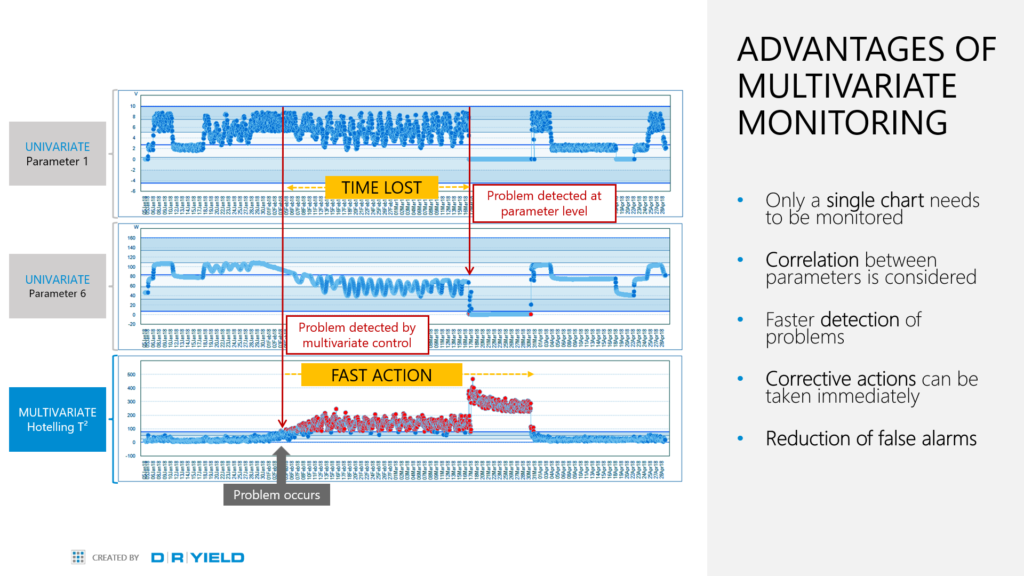
The case study from the screenshots above was analyzing some tool parameters. About 32 parameters were being monitored individually. Two of these parameters were the pressure and the flow in a tool. According to basic physics, there should be a correlation between pressure and flow.
The left side of this chart shows that at the very beginning of this time series these parameters are nicely correlating. But then, at a certain point, something happened.
What happened at this point in time was that a valve started to get leaky. The correlation between the pressure and the flow in the tool started to get distorted.
Looking at the individual parameters in process control, it can’t be recognized there’s a problem because all the measurements were within their respective control limits. However, the T2 statistic immediately went outside its control limits.
This was an ex-post analysis, so the problem was actually discovered at the point when the tool finally shut down completely.
The time between when the T2 values would have started triggering alarms – each of these red data points would have triggered an alarm – but because the multivariate analysis was applied after the event, about three weeks passed where no reaction happened.
“So this gave us a case study where we see that with multivariate monitoring, the problem could have been addressed much earlier”, says Rathei.
Another advantage of multivariate monitoring worth mentioning is that because you are monitoring only one chart instead of in this case 30 some charts, the T2 add a kind of robustness to the algorithms and it has been shown that you actually have a reduction in false alarms or in false positive alarms.
All in all, using multivariate monitoring in advanced data analytics and semiconductor testing helps manufacturers detect problems faster and take immediate corrective actions.

