Electrical test data (e.g. wafer sort data) often consists of dozens of correlated parameters and therefore it is no surprise that the application of multivariate statistics monitoring can significantly improve the effectiveness of the yield control concept.
The YieldWatchDog™ Multivariate Monitoring Module observes the correlation between multiple parameters and summarizes these correlations into a single chart.
What is Multivariate Statistics?
Monitoring of electrical test data for process control purposes is often done using simple univariate statistics. This means that specific or all test parameters are monitored independently one after the other.
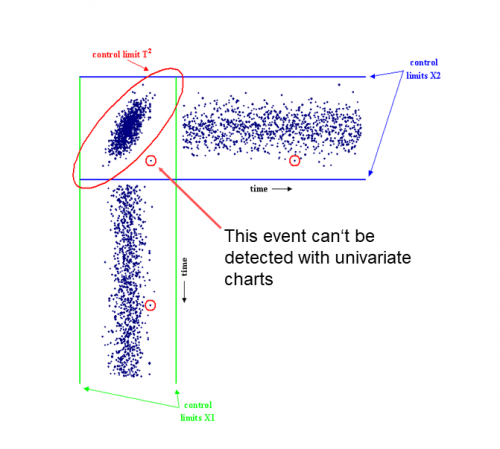
Figure 1 is a scatterplot of two parameters and their development over time. Each data point represents the average values of the two parameters on a single wafer. From the diagram we can deduce that each data point is within the control limits for both parameters in the time series charts. Control limits are indicated by the blue and green lines. The multivariate control limit is shown as an ellipse and labelled “control limit T²”.
By performing multivariate statistics, we can see that there is a data point (encircled) in the ellipse that is clearly not behaving like the majority of wafers and therefore stands out. This data point would certainly set off alarm bells. The same data point is encircled in the two time series charts, however these data points do not stand out from the majority of data points in the respective charts and would otherwise go completely unnoticed.

The above example is a bi-variate statistics, meaning exactly two parameters are being considered. Multivariate statistics groups multiple parameters into one T² control limit. Of course, this cannot be illustrated in a two-dimensional plane, but only calculated mathematically in a multi-dimensional space. A standard control chart is known as a Hotelling T² chart (named after the famous statistician Harold Hotelling). It basically plots the distance of data points from the center of their correlation ellipse (in the two-dimensional case) or the multi-dimensional ellipsoid, also known as hyperellipsoid, in the multi-variate case. A major advantage of the T² chart is that monitoring a single chart gives an instant overview over a large number of parameters.
Principal Component Analysis (PCA) is a dimension reduction technique that is implemented to reduce the data into its basic components, stripping away any unnecessary parts. It reduces the data set immensely and saves computation time.
Why Multivariate Monitoring?
The Multivariate Monitoring Module allows you to get the maximum out of your data.
Although univariate statistics has the advantage of being easy to monitor, the analysis of the data is often misleading because the correlation between the parameters is ignored.
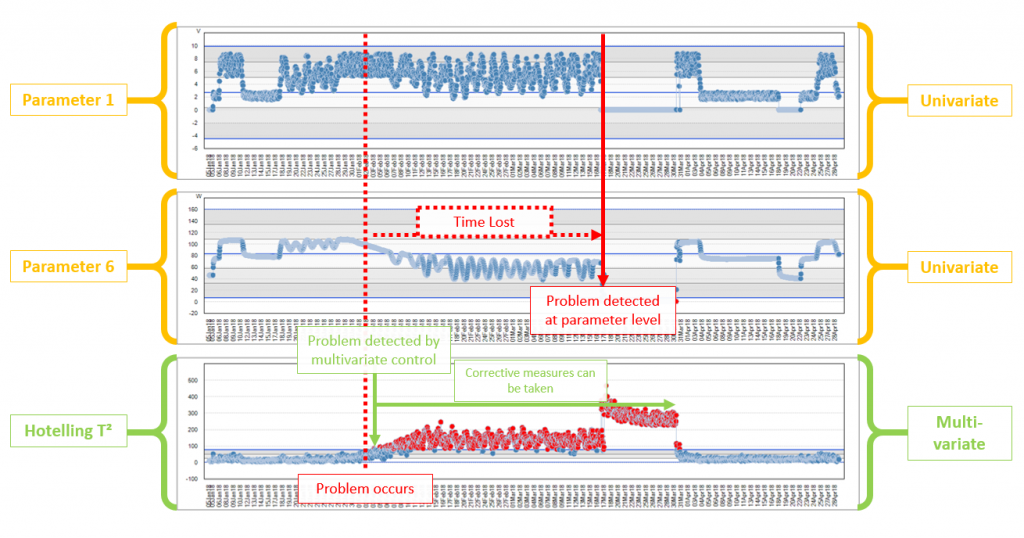
To explore beyond what is visible when looking at single parameters, we need multivariate statistical calculations to allow the correlation of multiple parameters thereby detecting behavior that is only visible when looking at a group of parameters. By deploying mechanisms such as PCA, extremely fast processing and calculation times can be assured. Only one chart needs to be monitored and there is a substantial reduction in the number of false alarms.
The diagram below shows an actual case how multivariate monitoring can save a lot of time when it comes to detecting problems.

About DR YIELD software & solutions GmbH
DR YIELD provides the leading-edge advanced analytics software YieldWatchDog for analysis and control of semiconductor manufacturing and test data. This enables semiconductor manufacturers as well as Fabless companies to improve important manufacturing dimensions such as equipment availability, throughput, operating costs and yield. Once installed YieldWatchDog allows you to get actionable insights into your data. For detailed information click here


